
The essence of business intelligence can be described in three steps: gathering data, modeling data, and visualizing data. It’s important to note the goal of business intelligence is always insight. Let’s briefly review these steps. Gathering data is the process of finding where the data resides in the business and acquiring it. The next step, modeling data, is the process of taking the data and logically arranging and mapping it so it can be viewed and analyzed further. Our last step, visualizing data, is taking the data, modeled or otherwise and expressing it in a visual way that helps deliver insight.
Now that we’ve examined what BI is, lets get into why it’s important. A good place to start is the Gartner Analytical Ascendency Model (shown below). According to this model, which is the gold standard by the way, there are four types of analytics that take us from hindsight into foresight. Listed from simplest to most complex, they are: descriptive, diagnostic, predictive, and prescriptive. It’s important to note that while they are listed from simplest to most complex, none are less important than the other and the later, more complex analysis depends on the simpler, earlier steps.
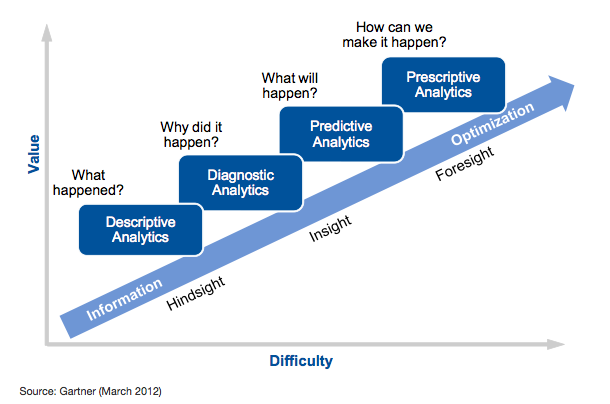
Let’s start with the simplest, descriptive analytics. Descriptive analytics strives to answer the question of “what happened?”. It is simply taking a look at historical data and viewing it over time or comparing it using historical ranges usually visualized in classic pie charts or bar graphs or something similar. It’s likely that this is something you’re already doing. While this may sound trivial, hindsight is 20/20. Knowing the past is the key to the future.
The next step is diagnostic analytics. It asks the question “Why did it happen?”, and it builds on the previous step. While it’s not the most sexy of the four, it definitely ranks high in importance. Deep diving into the data and understanding the “whys”, finding the relationships and correlations with similar or other outside data sources is infinitely valuable. Knowing the “why” can allow the business to pivot quickly and maximize resource prioritization where it will be most valuable for the business. It is also the catalyst for the next step, predictive analytics.
Predictive analytics wants to answer the question of “What will happen?”. In other words, can we apply “what happened” (descriptive) in the past and the understanding of “why it happened” (diagnostic) and predict what is coming next. Imagine being able to proactively know how and when to pivot to take advantage of momentum or even walk away from a bad situation. Talk about insight and giving the organization a competitive advantage. Saying the word “important” here really feels like an understatement. But it doesn’t stop here. As crazy as it sounds, there is more.
The final rung in the ascendency model is prescriptive analytics. Prescriptive analytics asks the question “how can we make it happen?”. It is marked by the fact that it provides actionable insights based on the descriptive and predictive steps. This is where multiple inputs can be analyzed to predict the best outcome for the business given certain scenarios. In case you missed it, this is where all the previous steps culminate to ALTER THE FUTURE. It does not get better than that. Imagine being able to tie recent business changes to customer satisfaction. What if you could predict customer adoption rates for the next feature? What if one small strategy move could send you miles past your competition? There are so many ways a data driven architecture gives you an edge, regardless of industry. A small list of examples of the insights that can be gained from business intelligence are below:
- Competition comparisons
- Customer behavior
- Increasing customer satisfaction
- Trend identification
- Performance metrics
- Marketing ROI
- Sales strategies
- Single, consolidated view of your data
- Decreasing costs
- Business efficiencies
- Market trends
- Trend forecasting